The global data set has 130 years of data (1880-2009).
Related Link: Global Temperature Anomalies, 2005-2009 Animation
Short narratives for each month are found below the last map.
Monitoring the Global Climate
Monthly Temperature Anomalies, Year 2009
| The dot maps, below, are a product of a merged land surface and sea
surface temperature anomaly analysis. Temperature anomalies with respect
to the 1971-2000 mean for land and ocean are analyzed separately and
then merged to form the global analysis. Note that
BLUE is BELOW normal and
RED is ABOVE normal, and the size of the dot
is proportional to the magnitude of the anomaly. Temperature
anomalies are noted in degrees Centigrade. The maps and data
analysis are from the
National
Climatic Data Center. This page was produced within the Applied
Climate Science Group of the School of Natural Resources, UNL. The global data set has 130 years of data (1880-2009). Related Link: Global Temperature Anomalies, 2005-2009 Animation Short narratives for each month are found below the last map. |
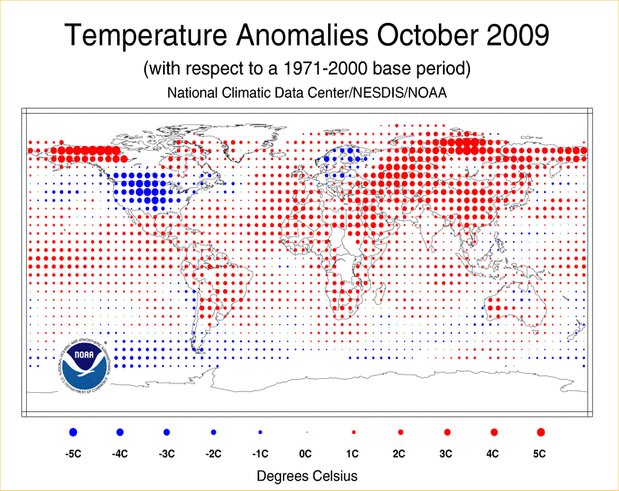
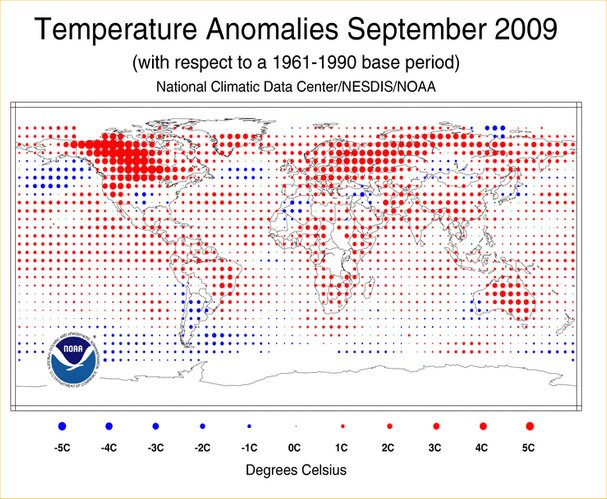
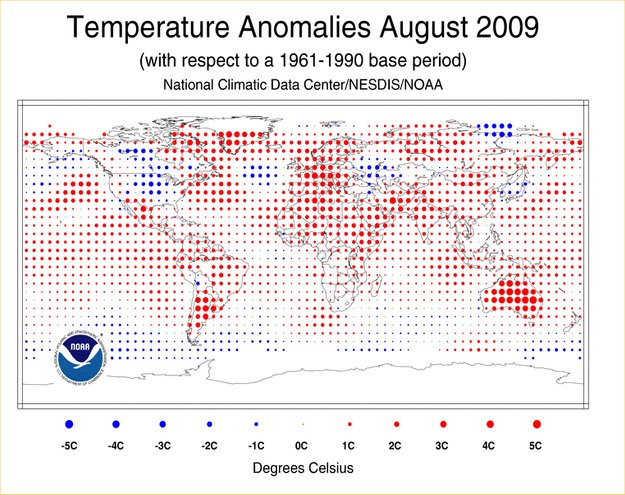
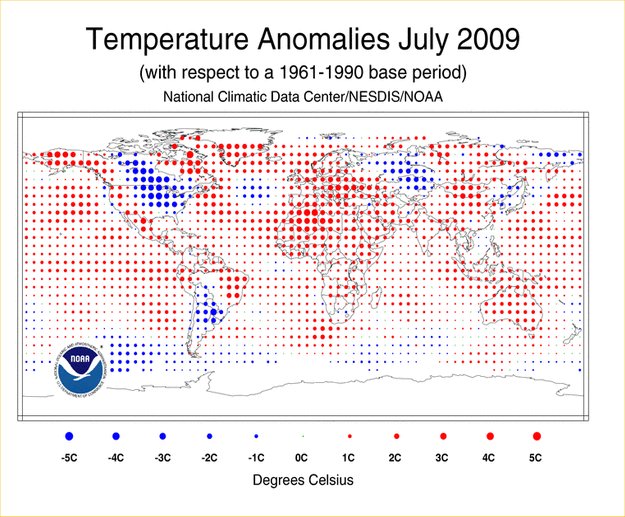
| DECEMBER 2009: The combined global land and ocean average surface temperature for December 2009 was 0.49°C (0.88°F) above the 20th century average of 12.2°C (54.0°F). This is the eighth warmest December on record. The worldwide ocean surface temperature for December 2009 was the second warmest—behind 1997—on record for December, 0.54°C (0.97°F) above the 20th century average of 15.7°C (60.4°F). This could be attributed to the strengthening El Niño across the equatorial Pacific Ocean. According to NOAA's Climate Prediction Center (CPC), El Niño is expected to continue through the Northern Hemisphere spring 2010. NOVEMBER 2009: The combined global land and ocean surface temperature for November 2009 tied with 2008 as the fourth warmest November on record since records began in 1880. The combined global land and ocean temperature anomaly was 0.60°C (1.08°F) above the 20th century average. Sea surface temperatures (SST) during November 2009 were warmer than average across much of the world's oceans, with cooler-than-average conditions across the higher-latitude southern oceans and northern parts of the Atlantic and eastern Pacific oceans. The November 2009 worldwide ocean SST also ranked as the fourth warmest on record, 0.51°C (0.92°F) above the 20th century average of 15.8°C (60.4°F). OCTOBER 2009: The combined global land and ocean surface temperatures for October 2009 ranked as the 6th warmest October on record since records began in 1880. Taken separately, the land areas and the ocean areas were both 6th warmest out of 130 years of data. As shown in the dot map above, warmer-than-average temperatures during the month of October were present across much of the world's land areas. The warmest anomalies occurred in the high latitudes of the Northern Hemisphere, specifically, in Alaska and northern and eastern Russia. Cooler-than-average conditions were present across the contiguous U.S., Scandinavia, New Zealand, and parts of northern Europe, northern Australia, and southern South America. SEPTEMBER 2009: The combined global land and ocean surface temperatures for September 2009 ranked as the second warmest September on record since records began in 1880. Similar to the combined global land and ocean temperatures, the worldwide land surface temperature was the second warmest September on record. The warmest anomalies occurred in Canada, the northern and western contiguous U.S., western Russia, and parts of Australia. The only below normal location in North America was centered over Nebraska and the Southern Plains. AUGUST 2009: The combined global land and ocean surface temperatures for August 2009 ranked as the second warmest August on record since records began in 1880. The combined global land and ocean temperature anomaly was 0.62°C (1.12°F), falling only 0.05°C (0.09°F) short of tying the record set in 1998. During the month of August, warmer-than-average temperatures were present across large portions of the world's land areas with the exception of cooler-than-average conditions across Japan, the central contiguous United States, parts of Canada, western Alaska, and western Russia. the Southern Hemisphere, both the August 2009 average temperature for land areas, and the Hemisphere as a whole (land and ocean surface combined), represented the warmest August on record. JULY 2009: The combined global land and ocean surface temperatures for July 2009 ranked as the fifth warmest on record in July since records began in 1880. However, the global land surface temperatures for July 2009 tied with 2003 as the ninth warmest July on record. Warmer-than-average temperatures were present across all land areas with the exception of cooler-than-average conditions across parts of eastern and western Asia, most of southern South America, central Canada, and the eastern half of the contiguous United States. The most notable cooler-than-average temperatures were recorded across the contiguous U.S. and central Canada. For the contiguous U.S., the average July temperature of 23.1°C (73.5°F) was the coolest since 1994. JUNE 2009: MAY 2009: The May 2009 map shows warmer-than-average temperatures across much of the world's land areas, with the most anomalous warmth over Alaska, Iceland, the western contiguous U.S., and much of Europe and Asia. Meanwhile, cooler-than-average conditions were present across New Zealand, Canada, and parts of western and central Asia and Australia. Temperatures were 2-5°C (4-9°F) below the 1961-1990 average across large areas in Canada APRIL 2009: During April 2009, warmer-than-average temperatures were present across Mexico, the northeastern and western contiguous U.S., eastern Canada, western Alaska, southern South America, northwestern Africa, and most of Europe, Asia, and Australia. In contrast, cooler-than-average temperatures occurred throughout western Asia and from the north central to the southeastern United States. MARCH 2009: During March 2009, warmer-than-average temperatures were present across Mexico, Europe, northwestern Africa, eastern Brazil, southern South America, northwestern and southeastern Australia, and most of Asia and the contiguous United States. In contrast, cooler-than-average temperatures occurred throughout southern Canada, southern Alaska, the north central and northwestern U.S., central Russia, and parts of western Australia FEBRUARY 2009: During February 2009, warmer-than-average temperatures were present across Mexico, northwestern Africa, southern Australia, eastern Europe, western Russia, southern Asia, eastern Brazil, western Alaska, eastern Canada, most of the continental U.S., and southern South America. In contrast, cooler-than-average temperatures occurred throughout Alaska's panhandle, northern Alaska, most of Russia, and parts of western Europe, and the Fenno-Scandinavia region. The majority of the globe experienced above normal temperatures. JANUARY 2009: During January 2009, warmer-than-average temperatures engulfed much of the land areas of the world, with the exception of cooler-than-average conditions across the northeastern and midwestern continental U.S., western Alaska, eastern Russia, western Europe, northwestern Africa, southeastern Asia, northeastern Australia, and northern Argentina. In contrast, warmest above-average temperatures occurred throughout Mexico, the Fenno-Scandinavia region, eastern Europe, southern Australia, the western half of the contiguous U.S., and most of Asia. Temperature anomalies in most of these regions ranged from 2.0°C-6.0°C (3.6°F-10.8°F) above normal. |