Lincoln, NE, September 2008 Weather and Climate Data
 
September 4, 2008:   View of Lincoln, NE, from Hardin Hall, (home of this web site) School of Natural Resources.   
Image © Ken Dewey, Applied Climate Sciences Group,
School of Natural Resources, UNL, 


Also See Our Photos of the Month Gallery (1998-2008)

LAST MONTH:  August 2008 Lincoln Data   

A foggy Early Autumn Morning in eastern Nebraska
Lincoln Summer Temperature Averages RANKED 1887 through 2008
A 10,000 Mile Trip Across the Arctic (Glaciers, Wildlife, Permafrost, Climate Change, and Scenery
 Nebraska Football game (August 29, 2008)
August 2008 Lincoln Temperature Graph Compared to Normal
Last 12 Months: September 1, 2007 - August 31, 2008 Lincoln Temperature Graph

Year 2008 Precipitation (in inches): compared to normal: red above normal, blue below normal

 
JAN
FEB
MAR
APR
MAY
JUN
JUL
AUG
SEP
OCT
NOV
DEC
TOTAL
2008
0.44
0.55
1.13
3.80 4.12 8.59 3.58
1.78
4.10
.
.
.
28.09
NORMAL
0.67
0.66
2.21
2.90
4.23
3.51
3.54
3.35
2.92
1.94
1.58
0.86
28.37
Normal January 1 - September 30 Precipitation = 23.99 inches

The total number of days with the temperature 90 degrees F or higher for Lincoln, NE
2008, 2007, 2006, 2005, 2004, 2003, 2002, and (1936 and 1934, the worst years ever) and Normals.

2008
2007
2006
2005
2004
2003
2002
1936
1934
NORMALS*
APRIL
0 days
1 day
0 days
0 days
1 day
1 day
1 day
0 days
0 days
0 days
MAY 
0 days
1 day
5 days
1 day
2 days
1 day
2 days
2 days
13 days
2 days
JUNE
3 days
5 days
11 days
12 days
3 days
2 days
19 days
17 days
17 days
8 days
JULY
18 days
16 days
21 days
20 days
7 days
19 days
22 days
29 days
28 days
16 days
AUGUST
11 days
19 days
12 days
 9 days
7 days
17 days
13 days
23 days
19 days
12 days
SEPTEMBER
1 day
3 days
1 day
 10 days
10 days
3 days
 7 days
11 days
1 day
 4 days
OCTOBER
   0 days
3 days
3 days
0 days
1 day
1 day
0 days
1 day
0 days
TOTAL
33 days
45 days
53 days
55 days
30 days
43 days
65 days
82 days
79 days
42 days
NORMALS* (standard 1971-2000, 30-year normals)

Lincoln's 90 F and 100 F Climatology (heat waves), 1887 through 2008

ALL September 2008 high temperatures of  90 F or higher are in RED

SEPT
2008
MAX
MIN
MEAN
DEP
PCPN
REC
PREC
REC
MAX
REC
MIN
HDD
CDD
AVG 
MAX
AVG
MIN
AVG
MEAN
Monday
Sept. 1
93
72
83
+12
0.00
2.60
106
42
0
18
83
59
71
Tuesday
Sept. 2
76
57
67
-4
1.29
1.63
106
43
0
2
83
59
71
Wednesday
Sept. 3
72
49
61
-10
0.00
2.37
102
35
4
0
83
58
71
Thursday
Sept. 4
76
50
63
-7
0.00
1.42
101
40
2
0
83
58
70
Friday
Sept. 5
64
51
58
-12
0.01
3.06
103
43
7
0
82
57
70
Saturday
Sept. 6 66 46 56 -13
0.54
1.91
105
41
9
0
82
57
69
Sunday
Sept. 7
73
49
61
-8
T
2.01
104
42
4
0
82
57
69
Monday
Sept. 8 65 48 57 -12
0.34
4.68
103
40
8
0
81
56
69
Tuesday
Sept. 9
72
41
57
-11
0.00
4.22
100
36
8
0
81
56
68
Wednesday
Sept. 10
76
55
66
-2
0.00
2.37
101
38
0
1
81
55
68
Thursday
Sept. 11
75
65
70
+2
1.38
1.59
99
29
0
4
80
55
68
Friday
Sept. 12 68 65 67 0
0.28
2.44
96
32
0
2
80
55
67
Saturday
Sept. 13 82 64 73 +6
0.01
1.41
102
34
0 8
80
54
67
Sunday
Sept. 14 69 46 58 -9
0.00
2.28
99
34
7 0
79
54
67
Monday
Sept. 15
77
40
59
-7
0.00
1.96
99
31
6 0
79
53
66
Tuesday
Sept. 16 83 48 66 0
0.00
2.53
100
34
0
1
79
53
66
Wednesday
Sept. 17 83 53 68 +3
0.00
1.94
101
35
0
3
78
53
65
Thursday
Sept. 18 81 50 66 +1
0.00
2.54
100
31
0
1
78
52
65
Friday
Sept. 19 80 54 67 +2
0.00
1.55
98
29
0
2
78
52
65
Saturday
Sept. 20 81 49 65 +1
0.00
2.61
95
31
0 0
77
51
64
Sunday
Sept. 21 82 51 67 +3
0.00
1.43
103
32
0
2
77
51
64
Monday
Sept. 22 85 65 75 +11
0.10
2.62
99
27
0
10
77
51
64
Tuesday
Sept. 23 81 60 71 +8
0.02
3.63
97
31
0
6
76
50
63
Wednesday
Sept. 24 83 53 68 +5
0.00
1.74
93
31
0
3
76
50
63
Thursday
Sept. 25 85 63 74 +11
0.00
2.32
93
29
0
9
76
49
63
Friday
Sept. 26 87 57 72 +10
0.00
1.60
95
28
0
7
75
49
62
Saturday
Sept. 27 82 57 70 +8
0.00
1.37
93
32
0
5
75
49
62
Sunday
Sept. 28 86 51 69 +8
0.11
4.70
102
28
0
4
75
48
61
Monday
Sept. 29
73
51
62
+1
0.02
1.75
94
26
3 0
74
48
61
Tuesday
Sept. 30
76
39
58
-3
0.00
1.64
94
28
7 0
74
47
61
TOTAL


4.10


.65 89.


Average
  77.8 53.3 65.5  


Normal
 
78.8
53.2
66.0
 
 2.92


100
123


Departure
  -1.0 +0.1 -0.5   +1.18       -35 -34      
SEPT
2008
MAX
MIN
MEAN
DEP
PCPN
REC
PREC
REC
MAX
REC
MIN
HDD
CDD
AVG 
MAX
AVG
MIN
AVG
MEAN
From the record books:
Hottest recorded September temperature, 
106 F September 2, 2000 and September 1, 1922.
Coldest recorded September temperature, 26 F, September 29, 1984.
Earliest ever first snowfall, September 28, 1985, 0.8 inches.

AVERAGE AND TOTAL are SEPTEMBER 2008.
NORMAL (Norm) is the 1971-2000 Standard normal.
MAX = Observed Maximum and MIN = Observed Minimum temperatures.
MEAN = Observed Mean Daily temperature.
DEP = Departure from normal ( __ = below normal, + above normal).
PCPN = Observed daily precipitation (midnight to midnight, CST).
REC PREC = Record daily precipitation amount for the day
REC MAX = Record maximum temperature.
REC MIN = Record Minimum temperature.
HDD = heating degree day units (base of 65 degrees).
CDD = cooling degree day units (base of 65 degrees).
AVG MAX = Daily Normal High Temperature (1971-2000 normals).
AVG MIN = Daily Normal Low Temperature (1971-2000 normals).
AVG MEAN = Daily Normal Mean Temperature (1971-2000 normals). 


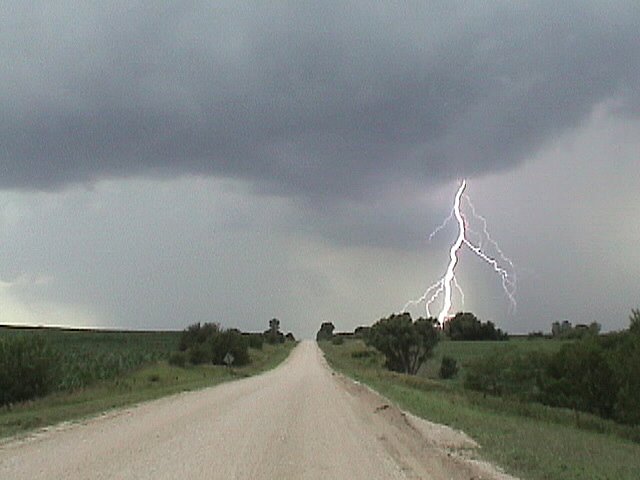
Jeremy Bower, Applied Climate Sciences, SNR, UNL.
Recent storm just west of Lincoln, NE.
UNL
University of Nebraska-Lincoln
Applied Climate Sciences Group
School of Natural Resources