Tornado Update for the U.S. and Nebraska, January 1-May 31, 2009
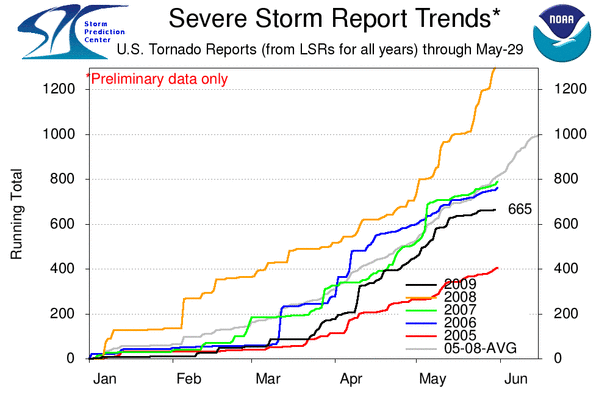
| There were 665 reported Year 2009 U.S. tornadoes as of May 29, 2009 (black line in the following graph). The Year 2009 total is approximately 50% of what the total was a year ago. Note how the May 2009 line on the graph basically becomes horizontal during May 2009 indicating the scarcity of tornadoes this year in the U.S. during May. The climatological peak month for tornadoes in the entire U.S. is the month of May (although the peak period in Nebraska is early June and late June in the northern portion of the High Plains) . Although we have passed the time of year which normally sees the most number tornadoes, it is not possible to predict what the rest of the season might bring in the way of tornadoes. If the current trend continues, however, we would expect that the number of tornadoes this year will be well below last year's total for the Great Plains as well as Nebraska., |
U.S. Tornadoes, January 1, 2009
-May 31, 2009
One of the primary reasons that there has been a lack
of tornadoes across the Plains has been the persistent drier than normal
weather pattern stretching back to last Winter.
The next two maps show the extent of the current dry conditions. Lincoln is
currently the 7th driest May on record, and the period of January 1 through May
28 is the 3rd driest on record for Lincoln (out of 123 years of data,
1887-2009). Omaha is a little better off, but still quite dry for the
year. Much of the area of the Great Plains is below normal
precipitation (yellow, orange and red) and parts of the area are less than 50% of
normal precipitation. The Nebraska - Kansas tornado alley is moisture
starved right now and until the gulf moisture returns, storms and tornadoes will
be fewer than normal. 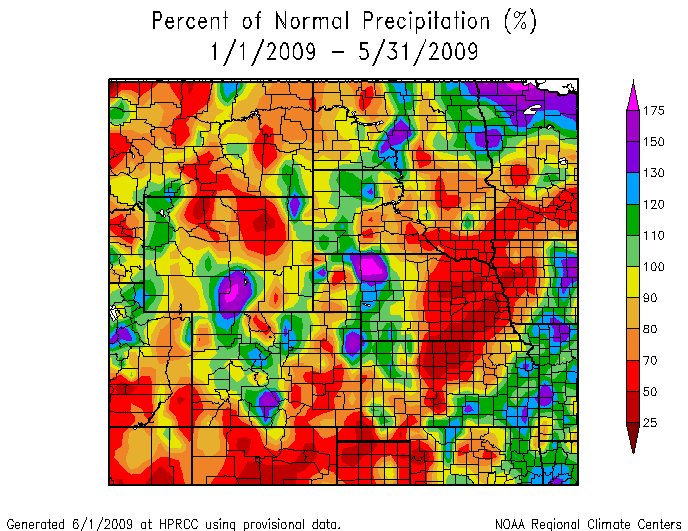 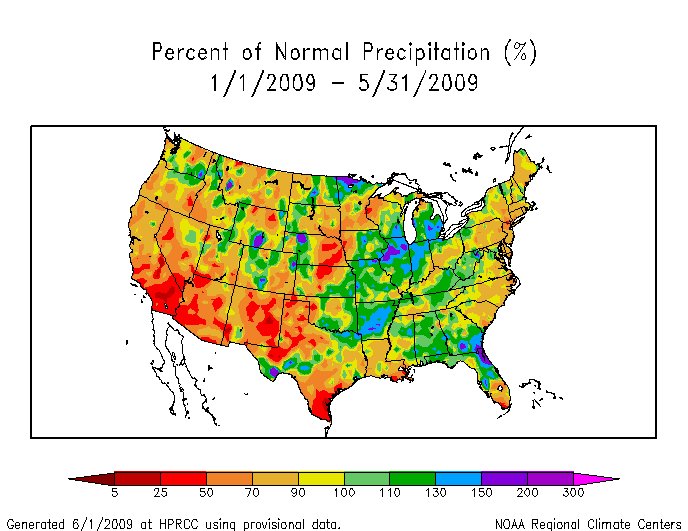 |
|
Nebraska Tornadoes, January 1,
2009 -May 31, 2009 January: none February: none March: 5 tornadoes (all on March 23) April: 4 tornadoes (all on April 4) May: 5 tornadoes, 4 on May 12, and 1 on May 23. Total of 14 tornadoes so far in 2009. Note that the total number is based upon "reports" and due to multiple counting of the same tornado, the number is usually lower once the data are examined at the end of the season. Therefore, the current total of 14 for this time period will probably be reduced later in the year. The following two maps show the location of the May 2009 tornadoes in Nebraska Here is May 12, 2009  Here is May 23, 2009  |
Here is an animation of all the May 2009 daily maps showing tornado reports (RED)
by Month and Year 1950-2008
| 2008 | 0 | 0 | 0 | 2 | 18 | 34 | 3 | 2 | 0 | 2008 | 59 | |||
| 2007 | 0 | 0 | 16 | 5 | 14 | 3 | 2 | 5 | 1 | 2007 | 46 | |||
| JAN | FEB | MAR | APR | MAY | JUN | JUL | AUG | SEP | OCT | NOV | DEC | |||
| Totals | ||||||||||||||
| Averages | ||||||||||||||
Why are there three different averages listed?
|
1.
The 1971-2000 is the current standard 30-year average time period.
A new 30-year average will be calculated for the 1981-2010 time period 2. The second average includes the years since 2000. 3. The third average, 1950-2008 is the average for the entire data set. It is lower due to the inclusion of the early years when data were under-reported. |
University of Nebraska-Lincoln Applied Climate Sciences Group School of Natural Resources |