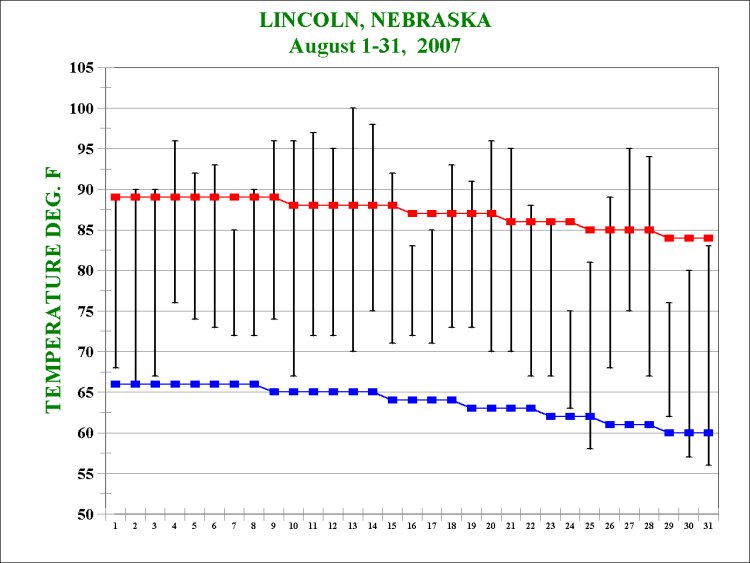
The vertical black bar shows the daily
observed high and low temperatures in degrees F.
The top of each bar is the high temperature
and the bottom of each bar is the low temperature.
The red line shows the 30 year (1971-2000)
normal highs.
The blue line shows the 30 year (1971-2000)
normal lows.