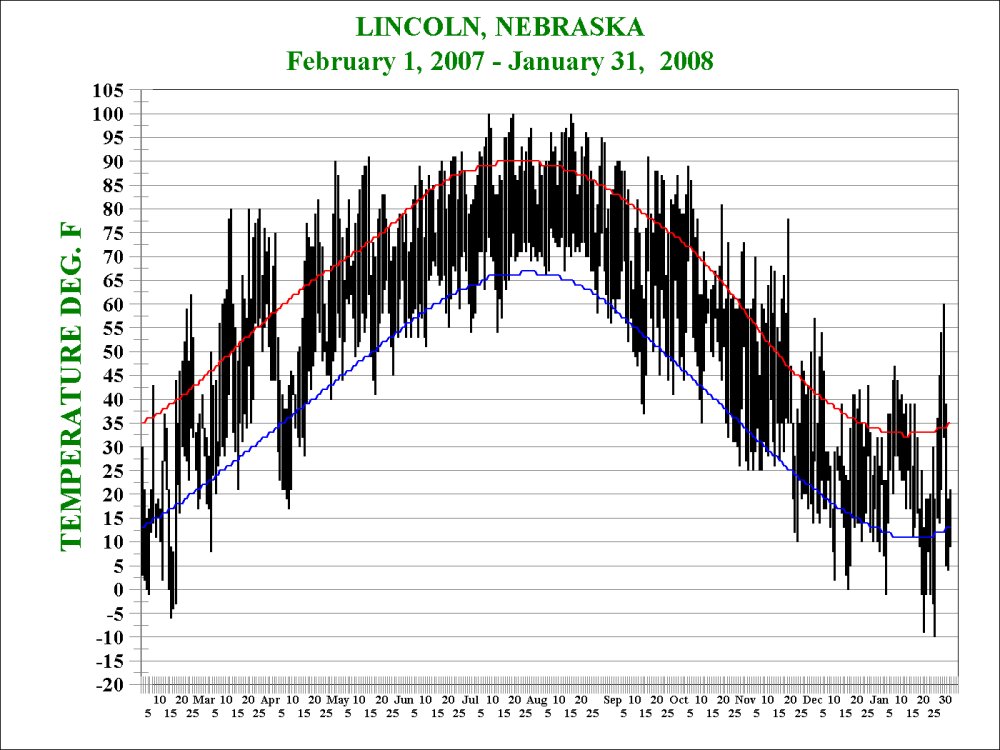
Daily high and low
temperatures for Lincoln, Nebraska.
The top of each vertical
black bar is the high temperature for the day and the bottom of each vertical
black bar is the low temperature for the day.
The curving red line
is the normal high temperature and the curving blue
line is the normal low temperature.
HOW TO INTERPRET THE
CHART: For example, on April 8, 2007:
the high temperature for
the day was 43 F and the low temperature for the day was 17 F.
The normal high for the
day is 61 F and the normal low for the date is 36 F
University of Nebraska-Lincoln Applied Climate Sciences Group School of Natural Resources |