
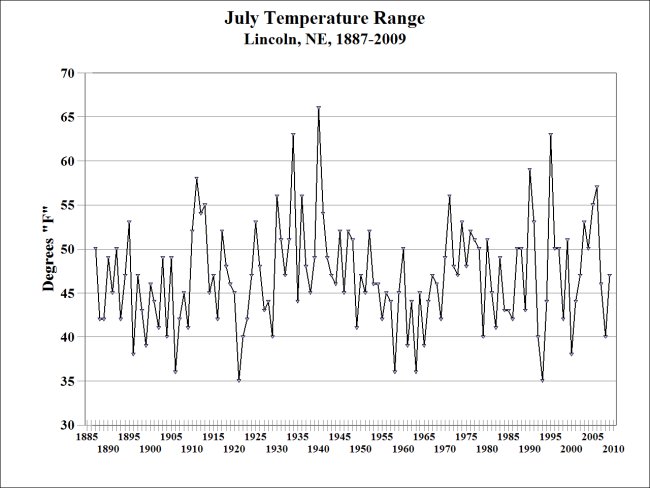
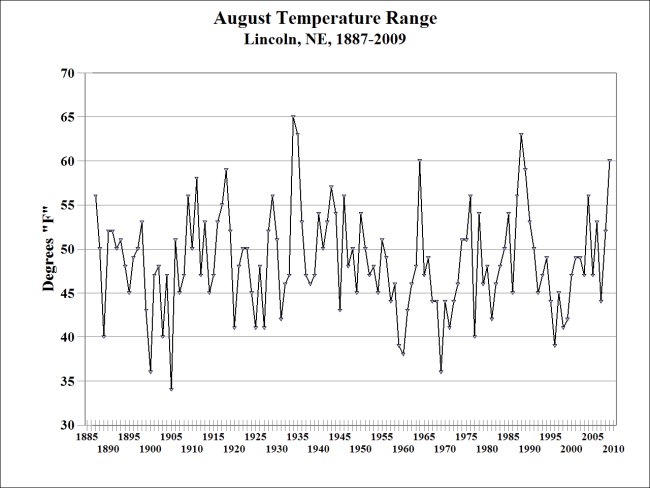
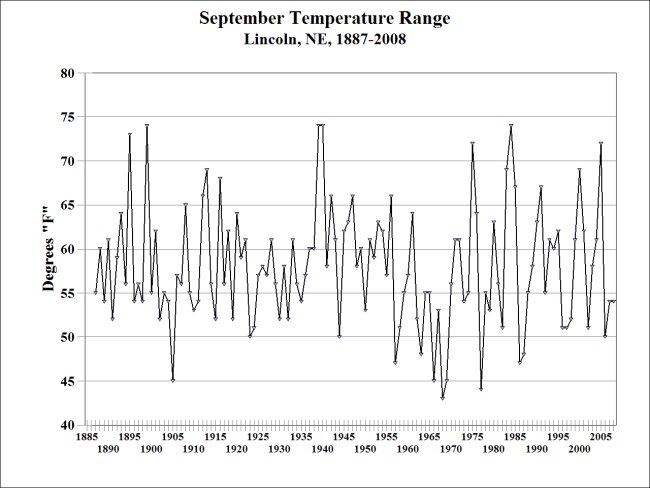
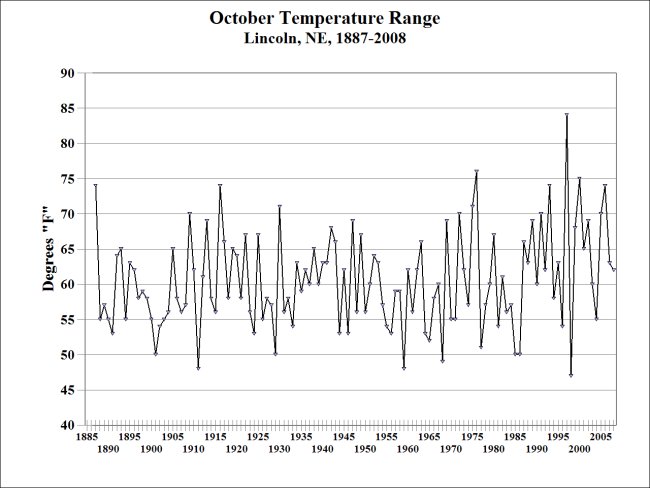
Lincoln Nebraska: Monthly Range in Temperature, Each Year, 1887-2009.
Months illustrated: July, August, September, October, November, and, December
|
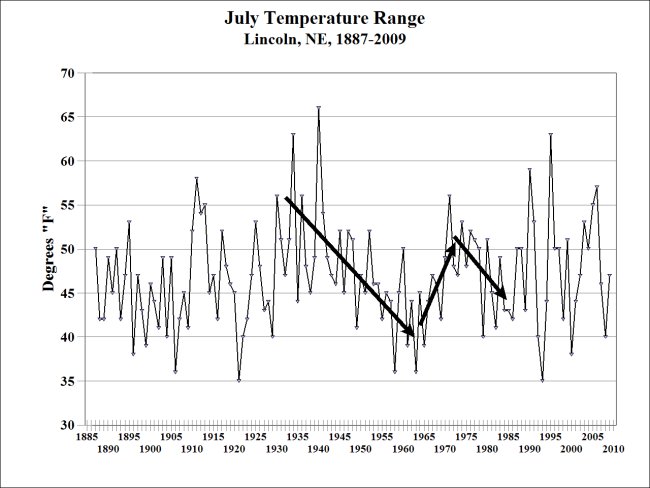
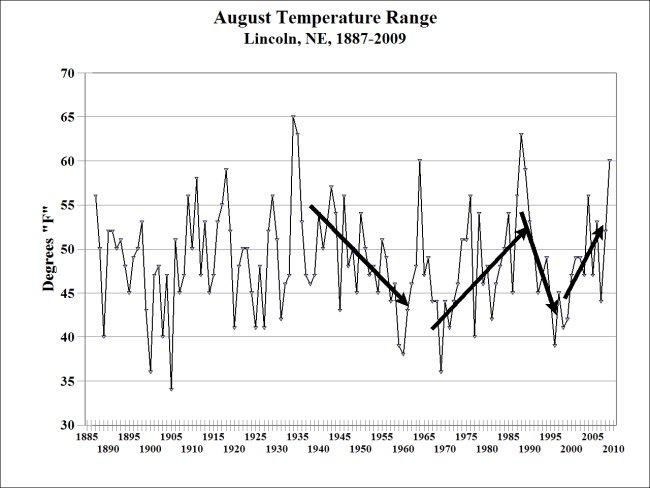
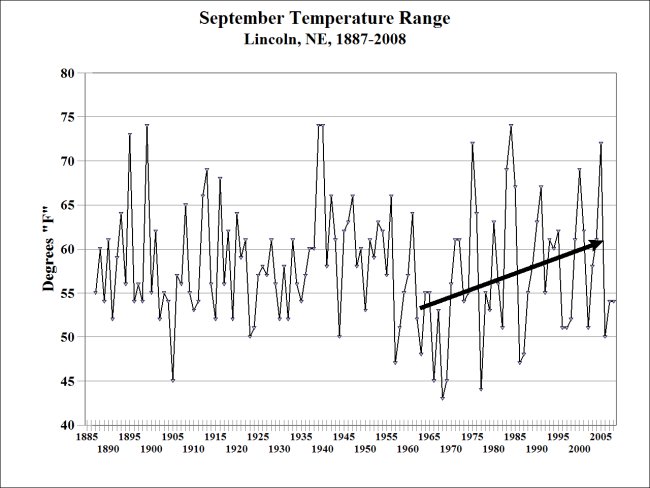
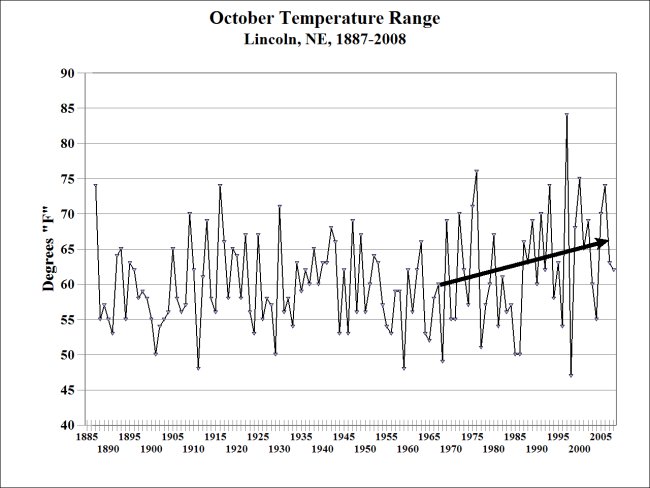
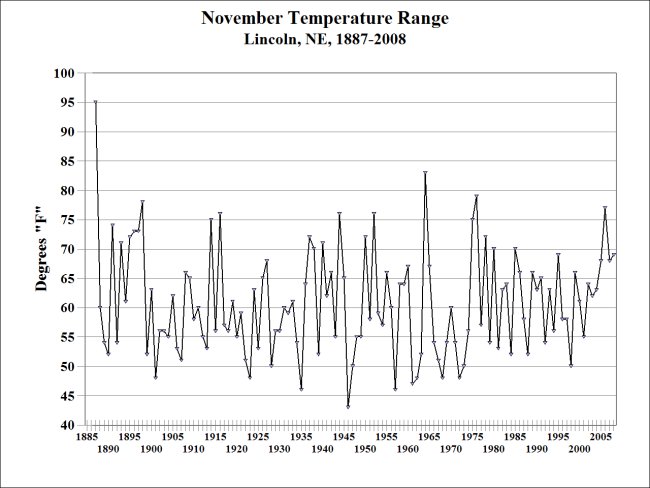
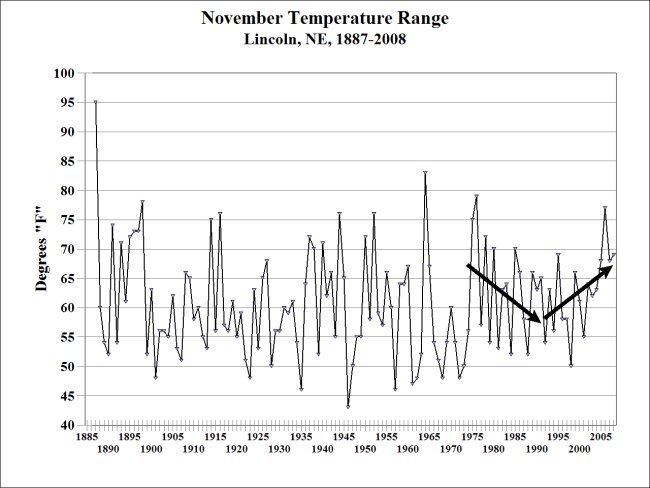
The larger the number on the graph, the larger the range or difference in temperature during that season. There are two time series graphs, with the 2nd one showing some recent trend lines.
When there is a significant recent trend in the data, a 2nd graph for that month will be included showing the trend line(s). For example, there is only one graph for December 1887-2008 since there was no recent trend in the temperature range. However, there are two November graphs since there is a recent trend in the November temperature ranges. |
</