
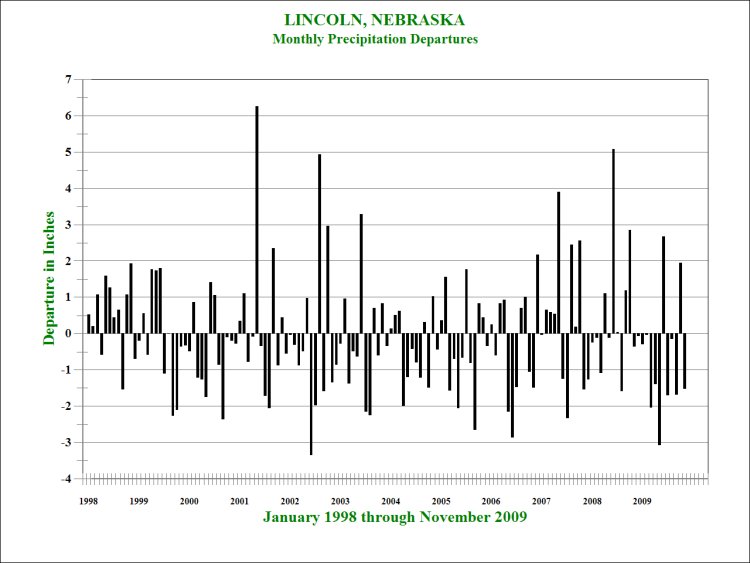
Interpretation:
The total precipitation of each month was
compared to the normal monthly
total precipitation for each month.
A value of "0" means the month
precipitation total was normal.
A negative value indicates below (drier
than) normal and a positive value
indicates above (wetter than) normal for
the specific month.
There were 143 months during the
January 1998 through November 2009 time period.
84 Months were drier than
normal
58 Months were wetter than
normal
1 month was exactly normal
All of the above data are the Official National Weather Service data for Lincoln, NE.
These data were acquired from the High Plains Regional Climate Center
|
School of Natural Resources |