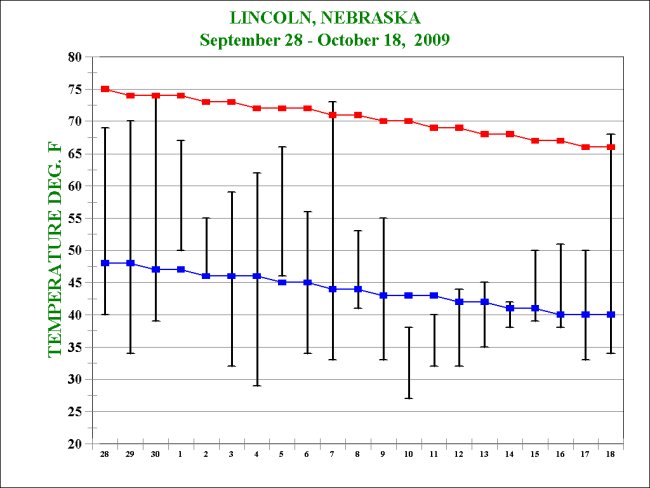
A record breaking cold wave hit Lincoln, NE in late
September and early October 2009. The mean temperature (the
average between the maximum and minimum temperature) fell below normal
on September 28 and did not rise above normal until October 18 (a
stretch of 21 days). The most notable feature of this cold wave
was the extremely cold daytime high temperatures which were actually, on
some days, colder than the normal low temperatures (see graph below).
On October 10, the high temperature for the day was only 38 F which was
32 degrees below normal.
A table listing the daily maximum (high) temperatures, daily minimum
(low) temperatures and daily mean temperatures compared to normal
(departure) for the September 28-October 18, 2009 time period can be
found below.
Three temperature records were set during this time period:
Record Low Temperature of 29 F on October 4, 2009 (tied previous
record of 29 F set in 1999)
Record Cold High Temperature of 38 F on October 10 (old record was 41 F
set in 1987).
Record Cold High Temperature of 40 F on October 11 (old record was 47 F
set in 1946).
September 28-October 18, 2009 was the coldest on record for that time
period out of 123 years of data (1887-2009).
The average maximum(high) temperature for the period was 56.5 F, ranked
coldest out of 123 years of data.
The average minimum (low) temperature for the period was 36.4 F, ranked
coldest out of 123 years of data.
The mean temperature for the period was 46.5 F and ranked coldest out of
123 years of data.
The top ten coldest are listed in a table below this.
Related Content:
Third Earliest Snowfall for Lincoln, NE
NOTE: All temperatures at this site are in degrees F.
| Day |
Max |
Norm |
Dep |
|
Day |
Min |
Norm |
Dep |
|
Day |
Mean |
Norm |
Dep |
|
Sep 28
|
69
|
75
|
-6
|
|
Sep 28
|
40
|
48
|
-8
|
|
Sep
28
|
55
|
61
|
-6
|
|
Sep 29
|
70
|
74
|
-4
|
|
Sep 29
|
34
|
48
|
-14
|
|
Sep
29
|
52
|
61
|
-9
|
|
Sep 30
|
74
|
74
|
0
|
|
Sep 30
|
39
|
47
|
-8
|
|
Sep 30
|
57
|
61
|
-4
|
|
Oct 1
|
67
|
74
|
-7
|
|
Oct 1
|
50
|
47
|
+3
|
|
Oct 1
|
59
|
60
|
-1
|
|
Oct 2
|
55
|
73
|
-18
|
|
Oct 2
|
46
|
46
|
0
|
|
Oct 2
|
51
|
60
|
-9
|
|
Oct 3
|
59
|
73
|
-14
|
|
Oct 3
|
32
|
46
|
-14
|
|
Oct 3
|
46
|
59
|
-13
|
| Oct 4
|
62
|
72
|
-10
|
|
Oct 4
|
29
|
46
|
-17
|
|
Oct 4
|
46
|
59
|
-13
|
| Oct 5
|
66
|
72
|
-6
|
|
Oct 5
|
46
|
45
|
+1
|
|
Oct 5
|
56
|
59
|
-3
|
| Oct 6
|
56
|
72
|
-16
|
|
Oct 6
|
34
|
45
|
-11
|
|
Oct 6
|
45
|
58
|
-13
|
| Oct 7
|
73
|
71
|
+2
|
|
Oct 7
|
33
|
44
|
-11
|
|
Oct 7
|
53
|
58
|
-5
|
| Oct 8
|
53
|
71
|
-18
|
|
Oct 8
|
41
|
44
|
-3
|
|
Oct 8
|
47
|
57
|
-10
|
| Oct 9
|
55
|
70
|
-15
|
|
Oct 9
|
33
|
43
|
-10
|
|
Oct 9
|
44
|
57
|
-13
|
| Oct 10
|
38
|
70
|
-32
|
|
Oct 10
|
27
|
43
|
-16
|
|
Oct 10
|
33
|
56
|
-23
|
|
Oct 11
|
40
|
69
|
-29
|
|
Oct 11
|
32
|
43
|
-11
|
|
Oct 11
|
36
|
56
|
-20
|
|
Oct 12
|
44
|
69
|
-25
|
|
Oct 12
|
32
|
42
|
-10
|
|
Oct 12
|
38
|
56
|
-18
|
|
Oct 13
|
45
|
68
|
-23
|
|
Oct 13
|
35
|
42
|
-7
|
|
Oct 13
|
40
|
55
|
-15
|
| Oct 14
|
42
|
68
|
-26
|
|
Oct 14
|
38
|
41
|
-3
|
|
Oct 14
|
40
|
55
|
-15
|
| Oct 15
|
50
|
67
|
-17
|
|
Oct 15
|
39
|
41
|
-2
|
|
Oct 15
|
45
|
54
|
-9
|
| Oct 16
|
51
|
67
|
-16
|
|
Oct 16
|
38
|
40
|
-2
|
|
Oct 16
|
45
|
54
|
-9
|
| Oct 17
|
50
|
66
|
-16
|
|
Oct 17
|
33
|
40
|
-7
|
|
Oct 17
|
42
|
53
|
-11
|
| Oct 18
|
68
|
66
|
+2
|
|
Oct 18
|
34
|
40
|
-6
|
|
Oct 18
|
51
|
53
|
-2
|
|