NOAA: November Warmer than Average in U.S., January-November Temperature Near Average for U.S.
December 11, 2008
The November 2008 temperature for the contiguous United States was warmer than the long-term average, according to NOAA’s National Climatic Data Center in Asheville, N.C. The January-November 2008 temperature was near average.
The average November temperature of 44.5 degrees F was 2.0 degrees F above the 20th Century average. Precipitation across the contiguous United States in November averaged 1.93 inches, which is 0.20 inch below the 1901-2000 average.
For the January-November period, the average temperature of 54.9 degrees F was 0.3 degree above the 20th Century average. The nation’s January-November temperature has increased at a rate of 0.12 degrees per decade since 1895, and at a faster rate of 0.41 degrees each decade during the last 50 years. All findings are based on a preliminary analysis of data based on records dating back to 1895.
U.S. Temperature Highlights
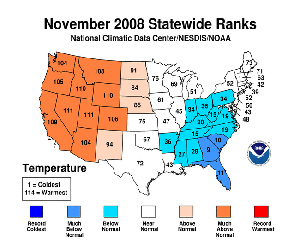
High resolution (Credit: NOAA)
- November temperatures were cooler than average across the Southeast and Central regions, and much warmer than average in the Southwest, Northwest and West regions.
- The West region had its fourth warmest November on record. This contrasted with the Southeast, which was much below normal.
- Persistent above-average temperatures for the last six months have resulted in a record warm June-November period for the West region. California set a record for its warmest June-November, while both Nevada and Utah had their fifth warmest June-November period.
- Based on NOAA's Residential Energy Demand Temperature Index, the contiguous U.S. temperature-related energy demand was 0.6 percent below average in November.
U.S. Precipitation Highlights
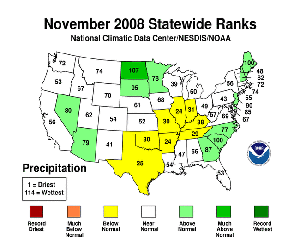
High resolution (Credit: NOAA)
- The United States measured above-normal precipitation across the northern Great Plains from eastern Montana to western Minnesota. However, November was drier than normal across much of the South and Central regions.
- Precipitation across most of the Midwest was only 50-75 percent of normal and some areas from southern Missouri through central Illinois received less than 50 percent of normal precipitation.
- The January-November period has been persistently wet across much of the country from the central Plains to the Northeast. The 11-month period was the wettest on record for New Hampshire and Massachusetts, second wettest for Missouri, third wettest for Vermont and Illinois, and fifth wettest for Maine and Iowa.
- At the end of November, 22 percent of the contiguous United States was in moderate-to-exceptional drought, about the same as October. Meanwhile, extreme-to-exceptional drought conditions continued in the western Carolinas, northeast Georgia, eastern Tennessee, southern Texas, and Hawai’i.
- About 26 percent of the contiguous United States was in moderately-to-extremely wet conditions at the end of November, according to the Palmer Index. This was a decrease of about three percent compared to October.
Other Highlights
- It was the wettest November on record in Yuma, Ariz., with 2.2 inches (5.6 cm) of precipitation – all of it falling on November 26. This was more than five times the November average.
- An early November blizzard forced more than 100 businesses and schools, and Interstate 90, to close in western South Dakota on Nov. 5 and 6. The blizzard brought total snow accumulations of 3 to 4 feet and drifts up to 20 feet in places.
- Several periods of strong northwesterly winds during the month resulted in mountain-enhanced snowfalls across the mountains of western Virginia, North Carolina, and extreme northern Georgia. Banner Elk, N.C. recorded 6.2 inches (15.7 cm) of snow during the month making it the snowiest November since 1983.
- Three separate wildfires, which scorched 41,000 acres in Southern California, destroyed 1,000 homes and prompted 15,000 people to evacuate from November 13-17.
NCDC’s preliminary reports, which assess the current state of the climate, are released soon after the end of each month. These analyses are based on preliminary data, which are subject to revision. Additional quality control is applied to the data when late reports are received several weeks after the end of the month and as increased scientific methods improve NCDC’s processing algorithms.
NOAA understands and predicts changes in the Earth's environment, from the depths of the ocean to the surface of the sun, and conserves and manages our coastal and marine resources.