Monitoring the Global Climate - Monthly Temperature Anomalies, August 2009
| The globe continues to exhibit well above
normal temperatures despite the recent cool weather in our part of the
world. Don't be mislead by our below normal temperatures, its
called "Global Warming", not "Nebraska Warming", and we were just
fortunate to be in one of the very small areas that has had below normal
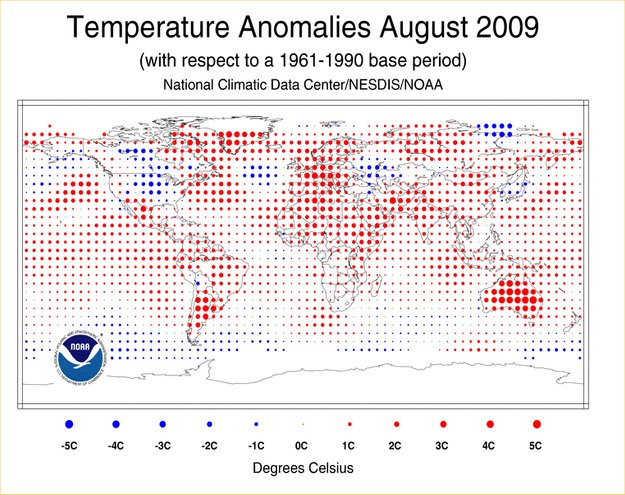
temperatures. Here's hoping for an above normal Winter. The dot map, below, is a product of a merged land surface and sea surface temperature anomaly analysis. Temperature anomalies with respect to the 1961-1990 mean for land and ocean are analyzed separately and then merged to form the global analysis. Note that BLUE is BELOW normal and RED is ABOVE normal, and the size of the dot is proportional to the magnitude of the anomaly. Temperature anomalies are noted in degrees Centigrade. The maps and data analysis are from the National Climatic Data Center. This page was produced within the Applied Climate Sciences Group of the School of Natural Resources, UNL. A Short narrative for this month is found below the map. LINK to other months |
AUGUST 2009:
The combined global land and ocean surface
temperatures for August 2009 ranked as the second warmest August on record since
records began in 1880. The combined global land and ocean temperature anomaly
was 0.62°C (1.12°F), falling only 0.05°C (0.09°F) short of tying the record set
in 1998. During the month of August, warmer-than-average temperatures were
present across large portions of the world's land areas with the exception of
cooler-than-average conditions across Japan, the central contiguous United
States, parts of Canada, western Alaska, and western Russia. the
Southern Hemisphere, both the August 2009 average temperature for land areas,
and the Hemisphere as a whole (land and ocean surface combined), represented the
warmest August on record.